

CR-I-TASSER is a new pipeline to integrate I-TASSER and cryo-EM density map for high-quality protein structure modeling.
CR-I-TASSER uses convolutional neural network to predict CA atom positions from the cryo-EM density map, which will be used to significantly improve the quality of threading templates and
further boosts the the accuracy of structure-assembly.
According to our benchmark, CR-I-TASSER is 87% better than the second state-of-the-art control group by modeling structures with TM-scores > 0.5.
CR-I-TASSER is a hierarchical method integrating iterative threading assembly refinement (I-TASSER) simulations cryo-EM density maps for high-accuracy protein structure determination. An overview of the CR-I-TASSER pipeline is shown in Figure 1, which consists of three consecutive steps: (1) initial data processing; (2) deep learning-based template refinement and regeneration; (3) density map guided structural reassembly simulations. (1) Starting from the amino acid sequence and density map, CR-I-TASSER first extracts the information of CA atom positions by using a 3D-CNN predictor which is shown in Figure 2. CR-I-TASSER also creates a set of deep MSAs by DeepMSA, which will then be used to generate inter-residue contact-maps by a set of six contact predictors: ResTriplet, TripletRes, ResPRE, ResPLM, and NeBcon. Meanwhile, multiple template structures are collected from the PDB by LOMETS, a meta-threading algorithm that ensembles 11 profile- and contact-based (CEthreader) threading programs. (2) The LOMETS threading templates are then optimized by the predicted CA conformations. Sophisticated algorithm is designed for superposing the threading templates into density map and re-ranking them, as shown in Figure 3. In case there is no good threading template for the target protein, another trace-generation pipeline is designed to regenerate templates from the predicted CA conformations. (3) The full-length structure models are constructed by reassembling the continuous fragments excised from the optimized templates through REMC simulations under the guidance of a composite force field consisting of cryo-EM density map restraints, contact-map restraints, threading-template-derived contact and distance maps, and a set of knowledge-based energy terms highly optimized through large-scale decoy-based energy-RMSD correlations. The REMC simulations generate a variety of structural decoys, which are subsequently clustered by SPICKER to select the lowest free-energy states. Starting from the centroid of the low free-energy clusters, a second round of structure reassembly simulations are performed to refine hydrogen-bonding networks and local structure packing. The low energy conformations from the second-round of simulations are further refined at the atomic-level by fragment-guided molecular dynamics (FG-MD) simulations to generate the final models.
 Figure 1. Pipeline of CR-I-TASSER.
 Figure 2. Architecture of 3D-CNN predictor (a) and the way how to predict CA conformations (b).
 Figure 3. Pipeline of template superposition into the density map and reselection.
Server inputs
The user needs to paste the fasta-formatted amino acid sequence into the input box, or upload the amino acid sequence of the query protein using the "Choose file" button.
The user also needs to upload the cryo-EM density map in mrc format using the "Choose file" button.
 Figure 4. Input of CR-I-TASSER.
Advanced Options
User-specified template(s) Users can specify template(s) and upload the tempalte(s) file using the "Choose file" button. User can also choose if the specified-template(s) will require superposition/rerank or not.
Exclude templates: CR-I-TASSER models are built by assembly of continuous fragments taken from known PDB structures (template). If "remove templates from protein sharing >30% sequence identity with target" is chosen, a template will not be used if it is homologous (sequence identity >30%) to the target sequence. In general, excluding homologous templates will make structure prediction harder, and therefore this option is only for benchmarking purposes.
Server outputs
The output of the CR-I-TASSER server includes:
An illustrative example of the CR-I-TASSER output can be seen from below:
 Figure 5. Target sequence and the corresponding prediction of secondary structure as well as solvent accessibility.
 Figure 6. Predicted models shown in the density map.
 Figure 7. Top-5 CR-I-TASSER models with PCC, cluster size and estimated TM-score.
 Figure 8. Table of top 10 LOMETS threading templates. Similar tables for templates after reselection and regeneration are also shown in the result page.
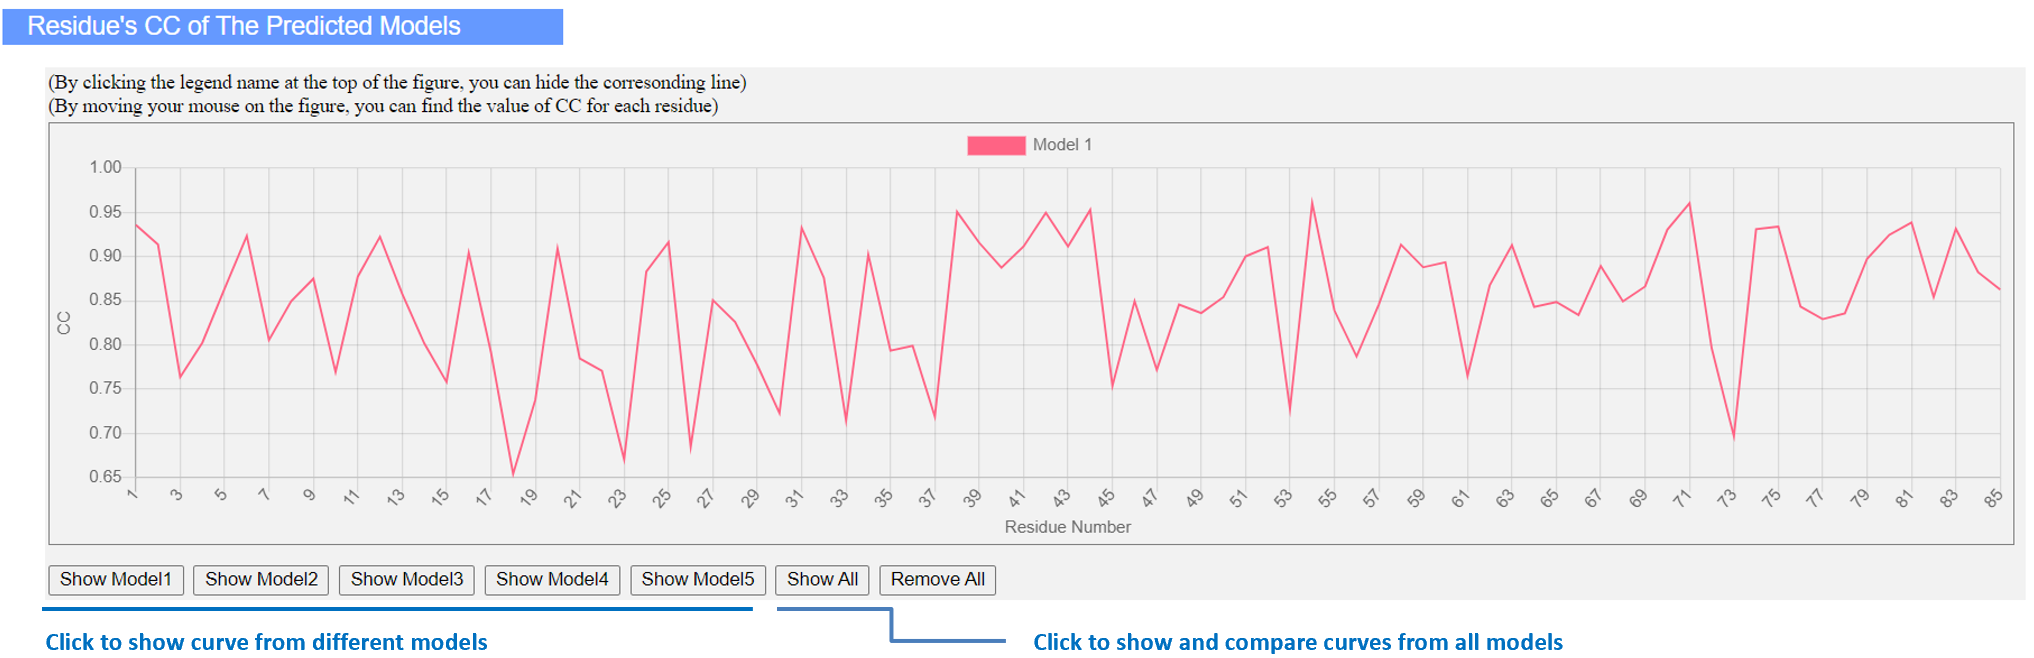 Figure 9. Residue CC along sequence between predicted models and density map.
Output tips
The output of the CR-I-TASSER modeling results are generally summarized
in a webpage, the link of which is sent to the user by their registered email after the modeling
is completed.
In the following, we present answers to several most frequently asked questions
in interpreting the CR-I-TASSER results:
For each target, CR-I-TASSER simulations generate tens of thousands of conformations (called decoys). To select the final models, CR-I-TASSER uses the SPICKER program to cluster all the decoys based on pair-wise structure similarity, and report up to five models which correspond to the five largest structure clusters. In Monte Carlo theory, the largest clusters correspond to the states of the largest partition function (or lowest free energy) and therefore have the highest confidence. The confidence of each model is quantitatively measured by estimated TM-score (see below). Since the top 5 models are ranked by the cluster size, it is possible that the lower-rank models have a higher estimated TM-score. Although the first model has a higher estimated TM-score and a better quality in most cases, it is not unusual that the lower-rank models have a better quality than the higher-rank models. If the CR-I-TASSER simulations converge, it is possible to have less than 5 clusters generated. This is usually an indication that the models are high quality because of the converged simulations.
Since the experimental structures are unknown for the user input sequence, we have designed a confidence score (estimated TM-score) to quantitatively estimate the quality of the CR-I-TASSER models. The estimated TM-score is a linear combination of three components: significance of the LOMETS2 threading alignments, satisfaction rate of the predicted contact-maps, and the decoy convergence degree of the CR-I-TASSER simulations. Based on benchmark testing, the estimated TM-score had a Pearson correlation coefficient (PCC) of 0.87 with TM-score. As a result of this high correlation, we were able to select an estimated TM-score cutoff of 0.5, corresponding to an estimated TM-score=0.5, and attain a Matthews correlation coefficient (MCC) on the benchmark dataset of 0.710. Therefore, the CR-I-TASSER models with estimated TM-score > 0.5 are considered to be successfully folded.
Estimated TM-score is a confidence score for estimating the quality of predicted models by CR-I-TASSER. It is calculated based on the agreement of predicted models and the density map, significance of threading template alignments, the convergence parameters of the structure assembly simulations, and the contact satisfaction rates. An estimated TM-score of higher value signifies a model of high confidence.
TM-score is a metric for measuring the structural similarity between two structures (see Zhang and Skolnick, Scoring function for automated assessment of protein structure template quality, Proteins, 2004 57: 702-710). The purpose of proposing TM-score is to solve the problem of RMSD which is sensitive to local errors. Because RMSD is an average distance of all residue pairs in two structures, a local error (e.g. a misorientation of the tail) will result in a big RMSD value although the global topology is correct. In TM-score, however, the small distance is weighted stronger than the big distance, which makes the score insensitive to local modeling errors. A TM-score > 0.5 indicates a model of correct topology and a TM-score < 0.17 means a random similarity. These cutoffs are not dependent on the protein length.
TM-score (or RMSD) is a known standard for measuring structural similarity between two structures and is typically used to measure the accuracy of structure modeling when the native structure is known. estimated TM-score is a metric that was developed for CR-I-TASSER to estimate the confidence of modeling. In the case where the native structure is not known, it becomes necessary to use the estimated TM-score predict the quality of the modeling prediction, i.e. the distance between the predicted model and the native structures.
In a benchmark test set of 1060 proteins, we found that estimated TM-score is highly correlated with TM-score. The PCC and MCC of the estimated TM-score of the first model with the TM-score to the native structure are 0.858 and 0.710 respectively. These data lay the base for the reliable prediction of the TM-score using estimated TM-score. In the output section, CR-I-TASSER only reports the quality prediction (TM-score and RMSD) for the first model, because it was found that the correlation between estimated TM-score and TM-score is weak for lower rank models. However, the estimated TM-score is listed for all models for reference.
We have found that the cluster size is more robust than estimated TM-score for ranking the predicted models. The final CR-I-TASSER models are therefore ranked based on cluster size rather than estimated TM-score in the output. Nevertheless, the estimated TM-score has a strong correlation with the quality of the final models, which has been used to quantitatively estimate the RMSD and TM-score of the final models relative to the native structure. Unfortunately, such strong correlation only occurs for the first predicted model from the largest cluster. Thus, the estimated TM-score of the lower-rank models (i.e., models 2-5) are listed only for reference and a comparison among them is not advised. In other words, even though the lower-rank models may have a higher estimated TM-score than the first model in some cases, the first model is on average the most reliable and should be considered first, unless the user has special reasons to choose other models (e.g., from biological sense or experimental data).
yangzhanglab![]() umich.edu
| (734) 647-1549 | 100 Washtenaw Avenue, Ann Arbor, MI 48109-2218
umich.edu
| (734) 647-1549 | 100 Washtenaw Avenue, Ann Arbor, MI 48109-2218