D-I-TASSER is an advanced protein structure prediction method built upon the I-TASSER framework, designed for high-accuracy modeling of protein structures and functions. It constructs full-length protein models by integrating deep learning-derived spatial restraints with state-of-the-art iterative threading assembly simulations. This page provides an overview of the D-I-TASSER methodology, usage guidelines, and its performance in large-scale benchmark evaluations and blind CASP experiments.
As shown in Figure 1 (upper panel), starting from a query sequence, the pipeline begins with multiple sequence alignment (MSA) generation using DeepMSA2. Structural templates and alignments are then identified by LOMETS3, which combines multiple contact- and profile-based threading algorithms. In parallel, multiple deep learning models, including AttentionPotential, DeepPotential, and AlphaFold2 (optional), are extended to predict spatial restraints, including contact/distance maps and hydrogen-bonding networks. These predictions are merged with LOMETS3-derived restraints into a unified potential termed "DeepPotential".
Guided by both the deep-learning and threading-based restraints, along with the I-TASSER energy force field, D-I-TASSER performs Replica Exchange Monte Carlo (REMC) simulations to generate a large ensemble of structural decoys. The lowest free energy models are selected through SPICKER clustering. These models are further refined by fragment-guided molecular dynamics (FG-MD) simulations with sidechain repacked via FASPR. Model quality is estimated by the estimated TM-score (eTM-score).
Figure 1 (lower panel) outlines the extension of D-I-TASSER for multi-domain protein modeling. Starting from the full-length sequence, a consensus of FUpred and ThreaDom is used to identify domain boundaries, where domain-level models are independently constructed using the single-domain D-I-TASSER protocol. Meanwhile, full-length MSA, spatial restraints, and template libraries are built from the full-chain sequence. The final full-chain structure is assembled using full-length D-I-TASSER simulations, guided by both domain-specific and global spatial restraints. Technically, domain-level folding of the full-length model is primarily driven by domain-specific threading and deep learning models, while the relative orientations between domains are determined by full-chain deep-learning restraints, inter-domain threading alignments, and the I-TASSER knowledge-based force field.
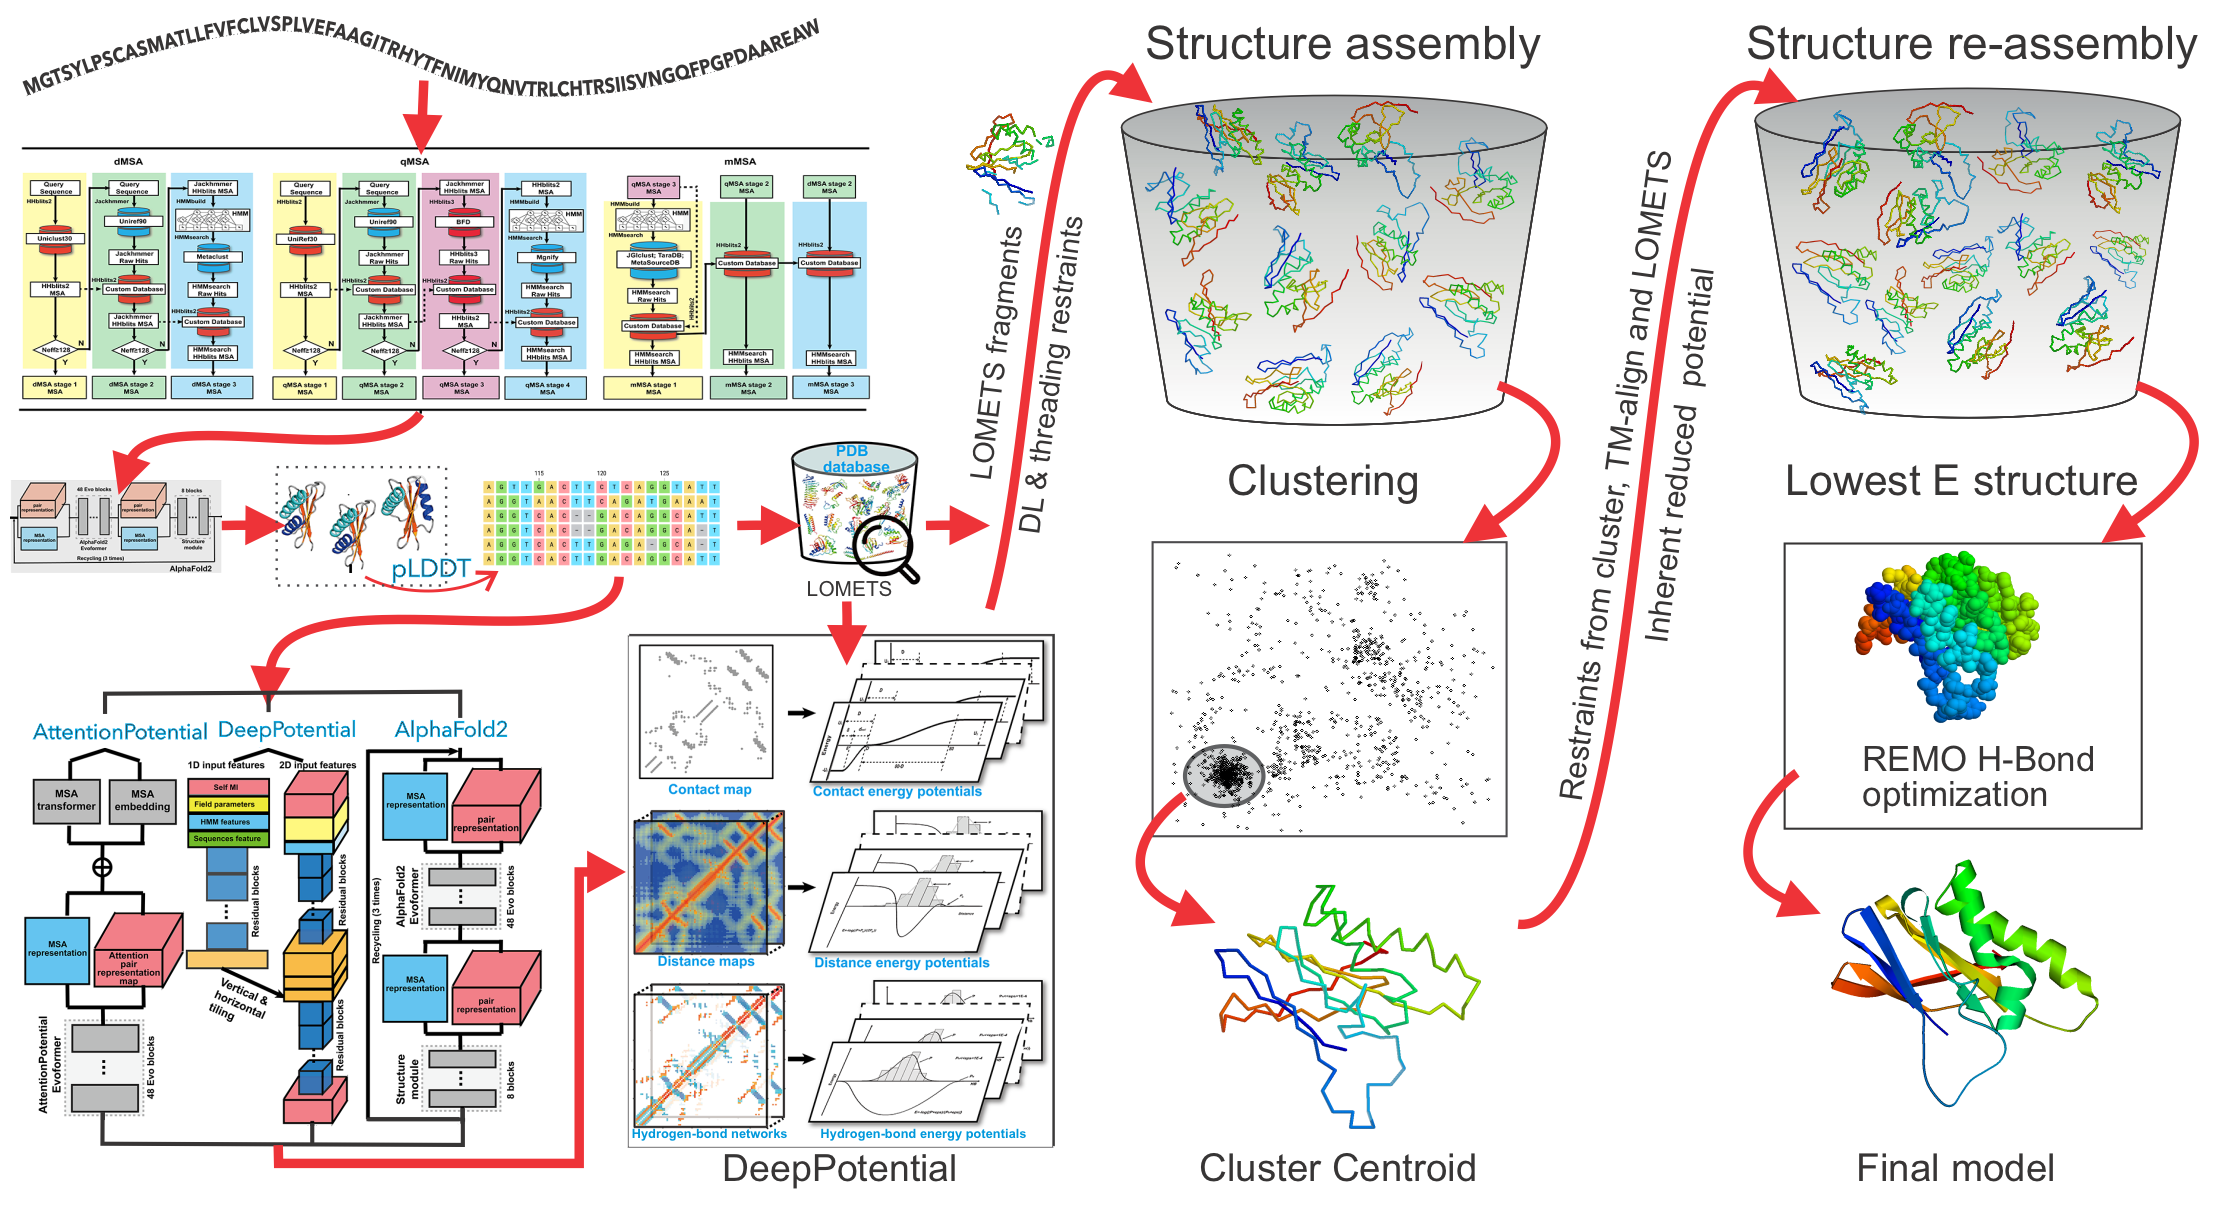
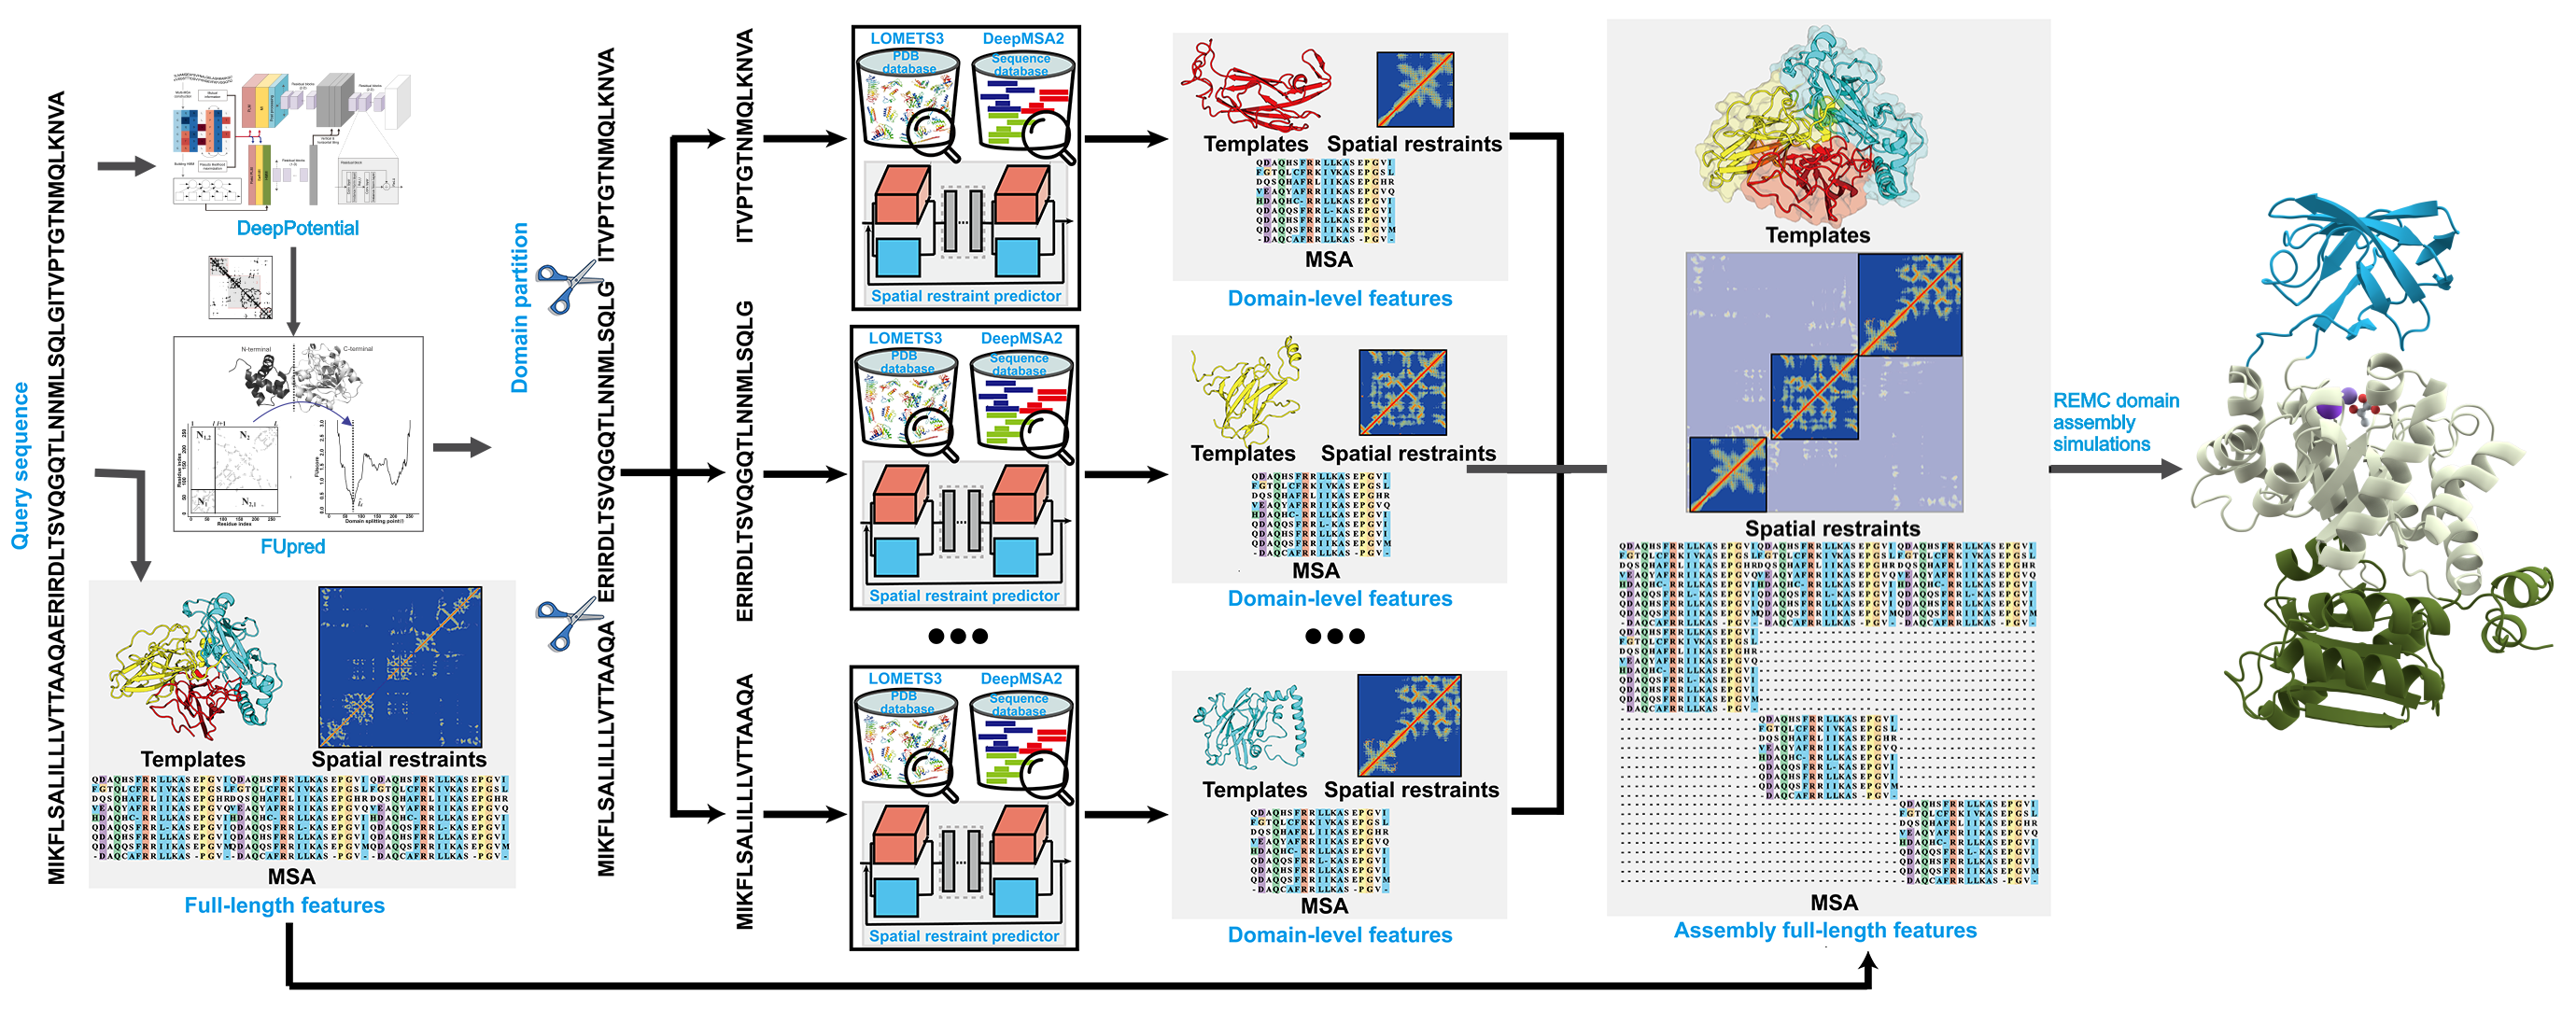 Figure 1. Protocol of D-I-TASSER for single-domain (upper panel) and multi-domain (lower panel) protein structure prediction.
The user needs to paste the fasta-formatted amino acid sequence into the input box, or upload the amino acid sequence of the query protein using the "Choose file" button.
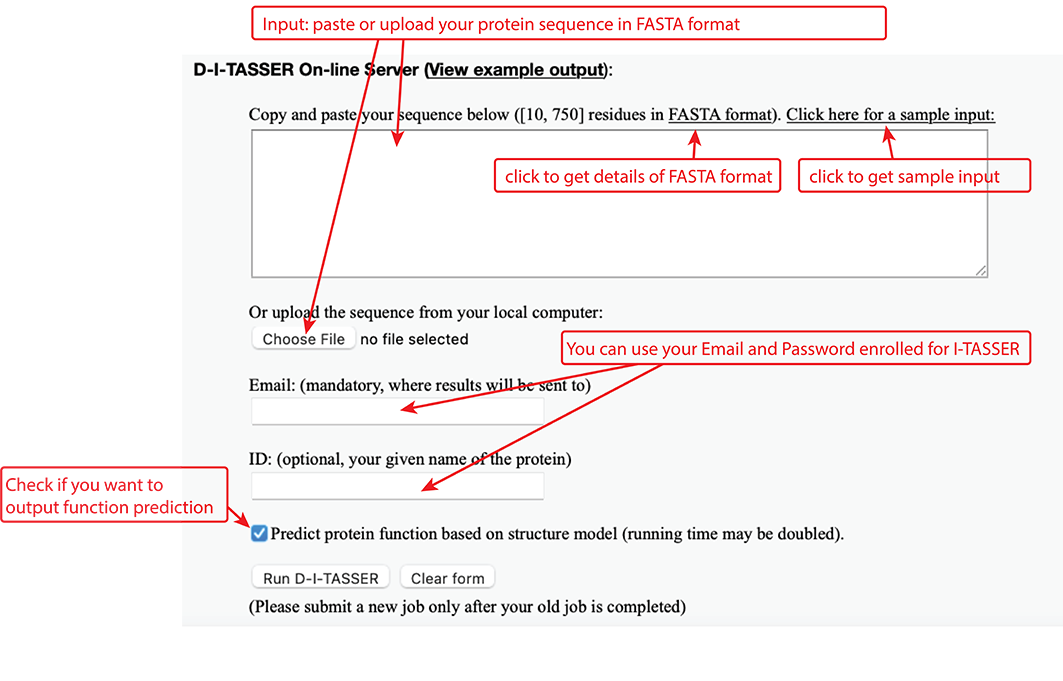 Figure 5. Input of D-I-TASSER.
An illustrative example of the D-I-TASSER output can be seen from below:
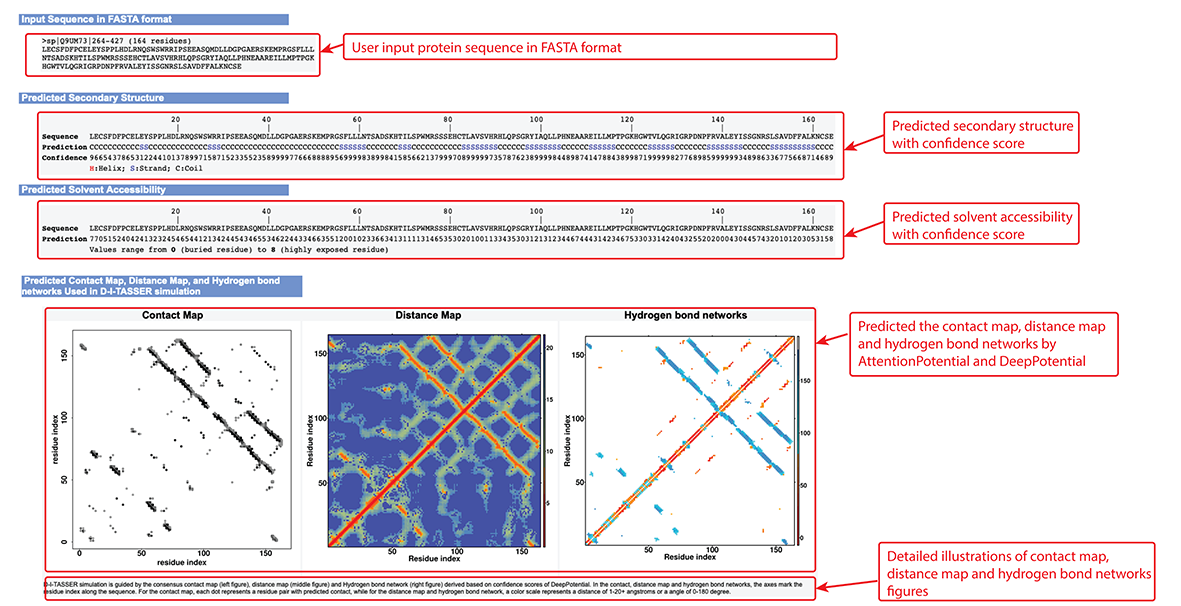 Figure 6. Secondary structure, solvent accessibility, contact map,distance Map, and hydrogen bond networks information in the D-I-TASSER output.
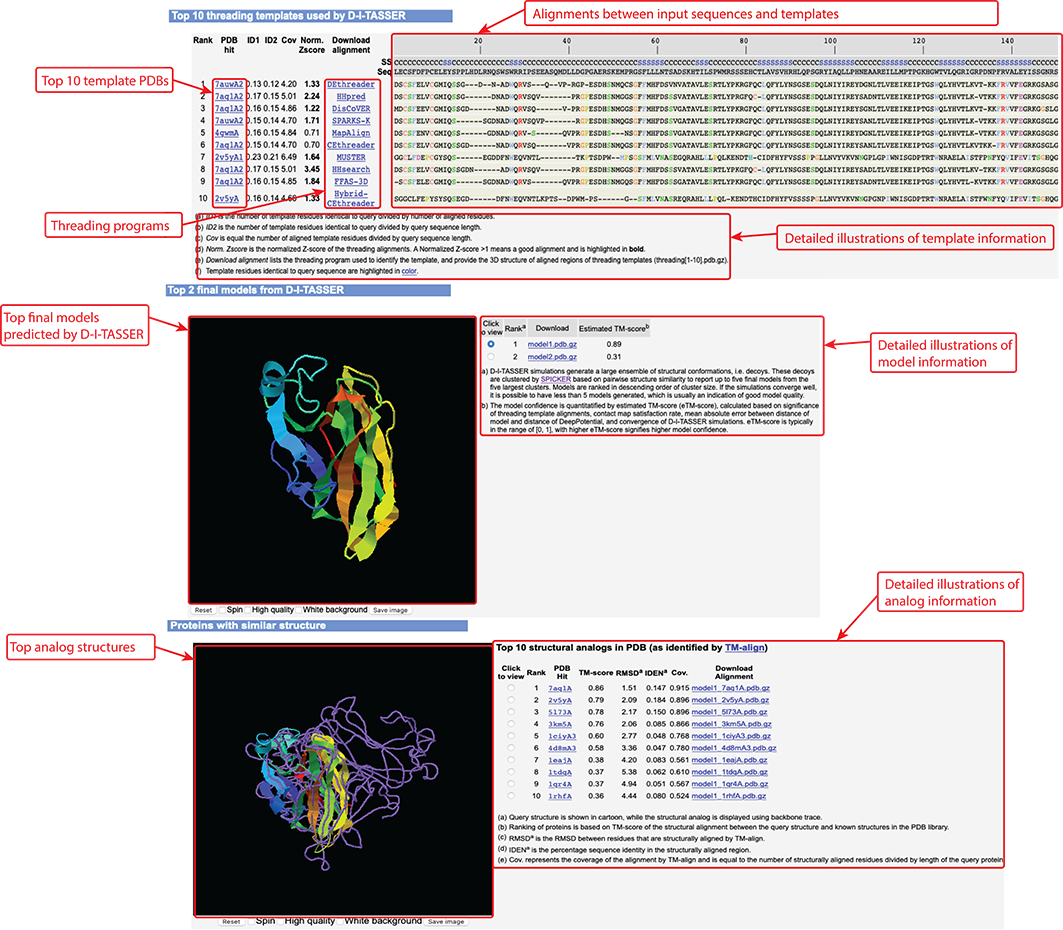 Figure 7. Templates, final models, and analog information in D-I-TASSER output.
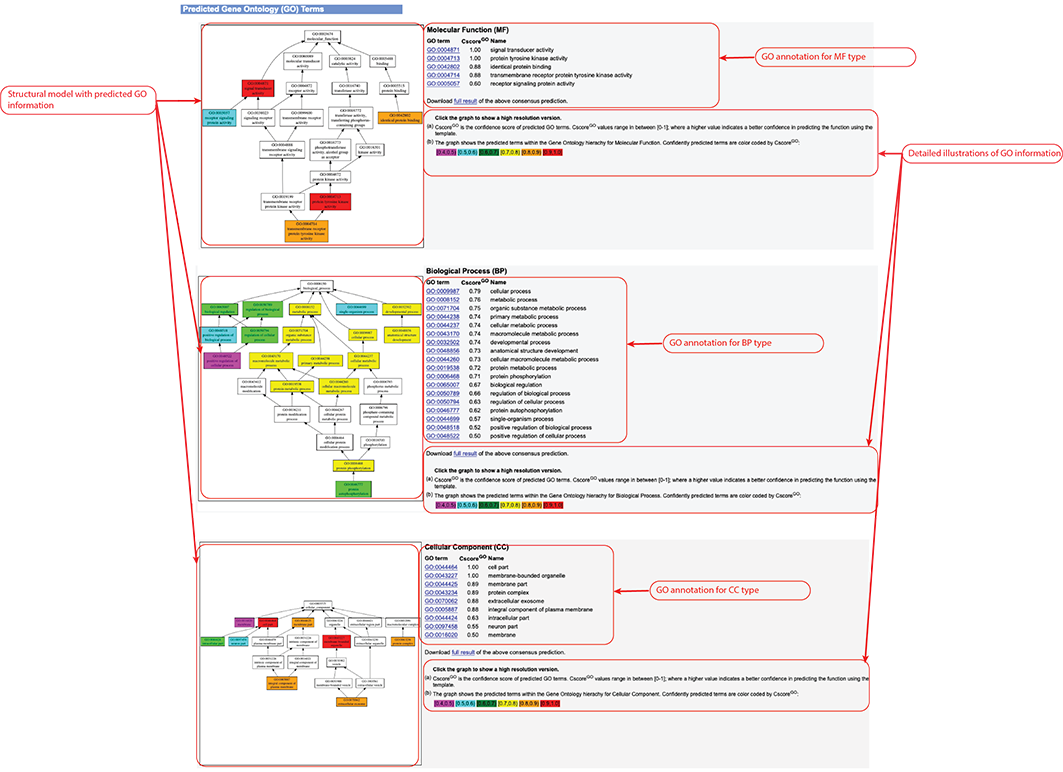 Figure 8. Gene Ontology (GO) Term prediction information in the D-I-TASSER output. This information is output only after you check the "Predict protein function based on structure model (running time may be doubled)." option of the input.
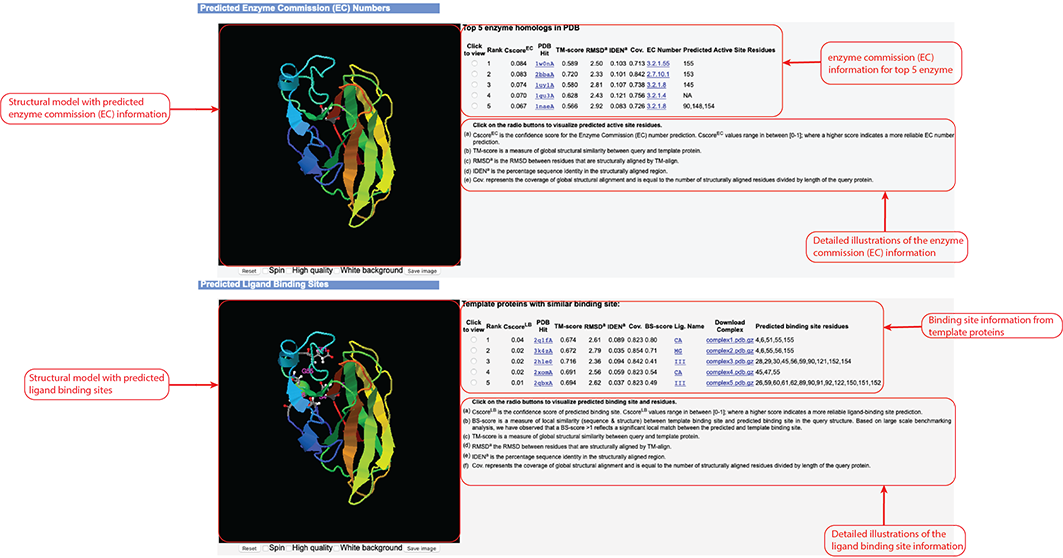 Figure 9. Enzyme Commission (EC) and ligand binding site prediction information in the D-I-TASSER output.
This information outputs only after you check the "Predict protein function based on structure model (running time may be doubled)."
option of the input.
Figure 9. Enzyme Commission (EC) and ligand binding site prediction information in the D-I-TASSER output.
This information outputs only after you check the "Predict protein function based on structure model (running time may be doubled)."
option of the input.
D-I-TASSER modeling starts from the structure templates identified by LOMETS3 from the PDB library. LOMETS3 is a meta-server threading approach containing multiple threading programs, where each program can generate tens of thousands of templates. D-I-TASSER only uses the templates of the highest significance in the threading alignments, which are measured by the Z-score (the difference between the raw and average scores in the unit of standard deviation). The top 10 templates are the 10 templates selected from the LOMETS3 threading programs. Usually, one (or two) template with the highest Z-score is selected from each threading program, where the threading programs are sorted by the average performance in the large-scale benchmark test experiments.
For each target, D-I-TASSER simulations generate tens of thousands of conformations (called decoys). To select the final models, D-I-TASSER uses the SPICKER program to cluster all the decoys based on pair-wise structure similarity, and report up to five models which correspond to the five largest structure clusters. In Monte Carlo theory, the largest clusters correspond to the states of the largest partition function (or lowest free energy) and therefore have the highest confidence. The confidence of each model is quantitatively measured by eTM-score (see below). Since the top 5 models are ranked by the cluster size, it is possible that the lower-rank models have a higher eTM-score. Although the first model has a higher eTM-score and a better quality in most cases, it is not unusual that the lower-rank models have a better quality than the higher-rank models. If the D-I-TASSER simulations converge, it is possible to have less than 5 clusters generated. This is usually an indication that the models are high quality because of the converged simulations.
After the structure-assembly simulation, D-I-TASSER uses the TM-align program to match the first D-I-TASSER model to all structures in the PDB library. This section reports the top 10 proteins from the PDB which have the closest structural similarity (i.e. the highest TM-score) to the predicted D-I-TASSER model. Due to their structural similarity, these proteins often have similar function to the target. However, users are encouraged to use the function prediction in D-I-TASSER output to obtain the biological function of the target protein, since D-I-TASSER predicts the function using COACH and COFACTOR, which have been extensively trained to derive function from many sequence and structure features, and as a result, these programs have a much higher accuracy than function annotations derived only from the global structure comparison.
Since the experimental structures are unknown for the user input sequence, we have designed an estimated TM-score (eTM-score) to quantitatively estimate the quality of the D-I-TASSER models. The eTM-score is a linear combination of three components: significance of the LOMETS3 threading alignments, satisfaction rate of the predicted contact-maps, the model fitting rate of predicted distance-maps, and the decoy convergence degree of the D-I-TASSER simulations. Based on benchmark testing, the eTM-score had a Pearson correlation coefficient (PCC) of 0.757 with TM-score. As a result of this high correlation, we were able to select an eTM-score cutoff of 0.5, corresponding to an estimated TM-score=0.5, and attain a Matthews correlation coefficient (MCC) on the benchmark dataset of 0.644 and a false discovery rate (FDR) of only 2.71%. Therefore, the D-I-TASSER models with eTM-score > 0.5 are considered to be successfully folded.
TM-score is a metric for measuring the structural similarity between two structures (see Zhang and Skolnick, Scoring function for automated assessment of protein structure template quality, Proteins, 2004 57: 702-710). The purpose of proposing TM-score is to solve the problem of RMSD which is sensitive to local errors. Because RMSD is an average distance of all residue pairs in two structures, a local error (e.g. a misorientation of the tail) will result in a big RMSD value although the global topology is correct. In TM-score, however, the small distance is weighted stronger than the big distance, which makes the score insensitive to local modeling errors. A TM-score > 0.5 indicates a model of correct topology and a TM-score < 0.17 means a random similarity. These cutoffs are not dependent on the protein length.
eTM-score is designed to quantitatively evaluate the quality of the D-I-TASSER models. It is derived from a linear combination of 4 components, including the significance of LOMETS threading alignments, the satisfaction rate of predicted contact-maps, the model fitting rate of predicted distance-maps, and the decoy convergence degree of D-I-TASSER simulations. An eTM-score of higher value signifies a model of high confidence.
TM-score (or RMSD) is a known standard for measuring structural similarity between two structures and is typically used to measure the accuracy of structure modeling when the native structure is known. eTM-score is a metric that was developed for D-I-TASSER to estimate the confidence of modeling. In the case where the native structure is not known, it becomes necessary to use the eTM-score predict the quality of the modeling prediction, i.e. the distance between the predicted model and the native structures.
In a benchmark test set of 797 proteins, we found that eTM-score is highly correlated with TM-score. The correlation coefficient of the eTM-score of the first model with the TM-score to the native structure is 0.757. These data lay the base for the reliable prediction of the TM-score using eTM-score. In the output section, D-I-TASSER reports the eTM-scores of all predicted models for reference.
zhanglab![]() zhanggroup.org
| +65-6601-1241 | Computing 1, 13 Computing Drive, Singapore 117417
zhanggroup.org
| +65-6601-1241 | Computing 1, 13 Computing Drive, Singapore 117417